Chart.js
March 09, 2017 - Søren Alsbjerg HørupIn the past I have used D3.js and even Highchart.js for my charting needs. Today, I decided to tryout yet another Open Source alternative: Chart.js.
Chart.js is available through npm and @typings also exists for TypeScript fans such as myself:
npm install chart.js —save
npm install @typings/chart.js —save
Chart.js can be included with the script tag, CommonJs, ES6 and RequireJS. Although for HTML5 programming I always do the legacy route using script tag (I know.. I need to move with the tech).
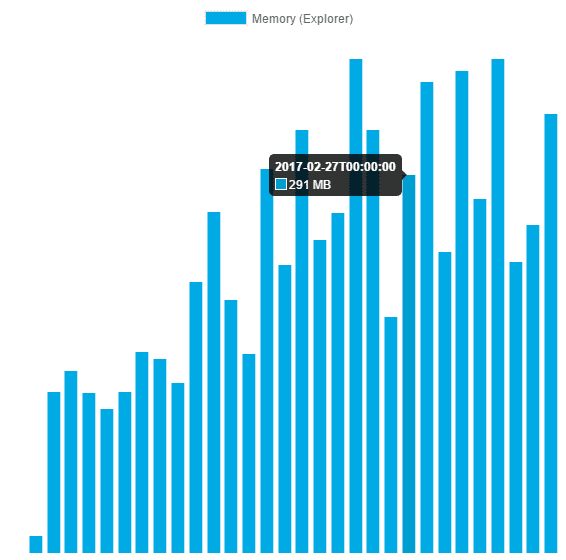
Chart rendering happens in a canvas, nothing fancy DOM manipulation which I really like, especially when working with ReactJS. The chart look and feel is very generic, nothing fancy here.
I really like the tool-tips though:
Chart.js is also responsive, thus scaling to different screen sizes. I have yet to tryout this feature though. Apart from this, it supports animation, multiple axis, mixed chart types, and more.
8 chart types are provided out of the box. Definitely recommended.
